

Through this article, we are going to understand how to trade head and shoulder, cup & handle chart patterns. These are frequently occurring patterns and very reliable patterns which offer a good risk to reward ratios to trade. So, let us discuss every pattern one by one.
This is one of the most important and frequently occurring chart patterns in the markets. These are the reversal patterns and generally form at the market tops. These are very reliable patterns but the failure of these patterns does occur. When failure of this pattern takes place then price reverses and can trade in an explosive manner in the other direction hence, it is always important to place a stop-loss whenever you take a trade.
Most of the head and shoulder patterns can be detected with the help of volumes, during the formation of the left shoulder and the beginning of the head formations volume will be heavy. While forming the right shoulder the volume will be comparatively less and increases immensely at the breakdown.
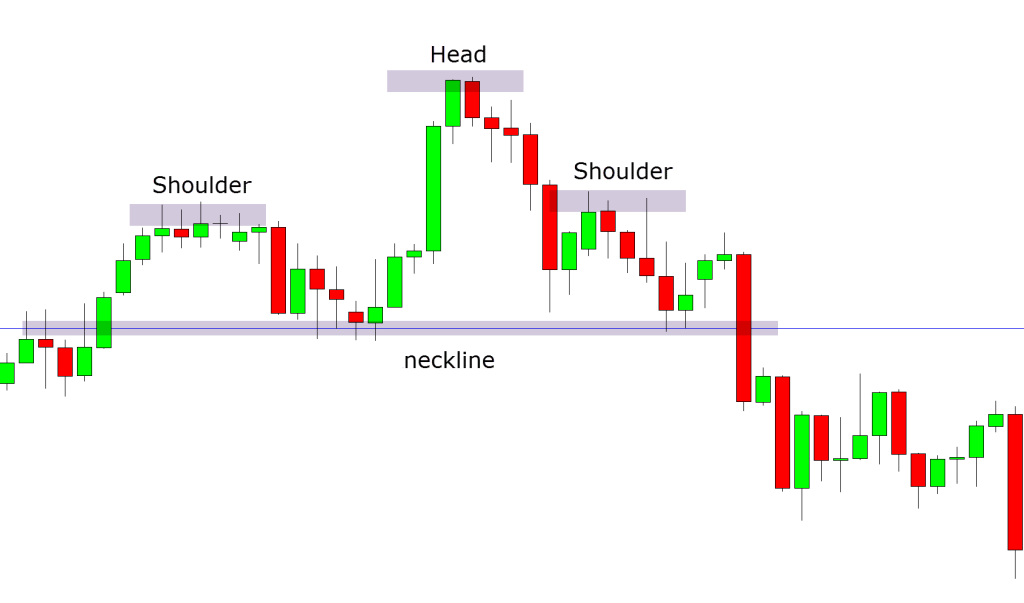
For trading Head and Shoulder Pattern, connect the swing lows with the neckline. When prices close below the neckline, the potential short trade can be initiated, short one tick below the breakdown bar’s low and the target for this pattern can be set equal to the vertical distance between the top of the head and the neckline. If you want to place your stop loss aggressively then it can be placed just above the neckline or if you are a safe trader then the stop loss can be placed above the right shoulder.
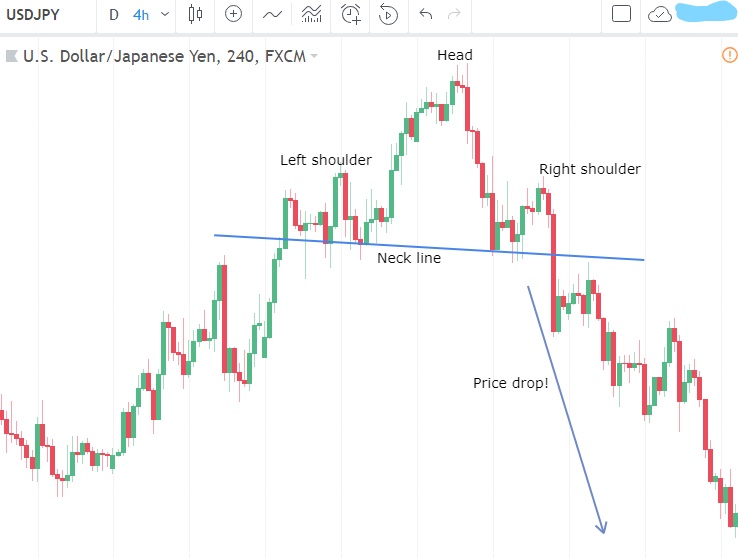
Also, there is not a rule that the neckline for this pattern must be horizontal, in some of the head and shoulder patterns the neckline can be slanted as well but the main parameter we need to check is volume. For trading head and shoulder pattern volume must be checked at the Left shoulder, Head, and Right shoulder.
Example of Head and Shoulder pattern with slanted neckline –
The Cup and Handle Chart Pattern is a continuation chart pattern and it is generally formed in the bullish market. These are very reliable and offer great trades. In this pattern, cup formation is developed during price rallies from the round bottom. The handle is formed due to correction before a clear breakout to the upside.
Trade can be initiated after the breakout from the handle. The handle part of this pattern usually corrects about 25% to 38% compared to the depth of the cup from the high pivot point to the bottom of the cup. After the formation of the handle, the pattern will pick up its previous trend and a potential breakout can occur.
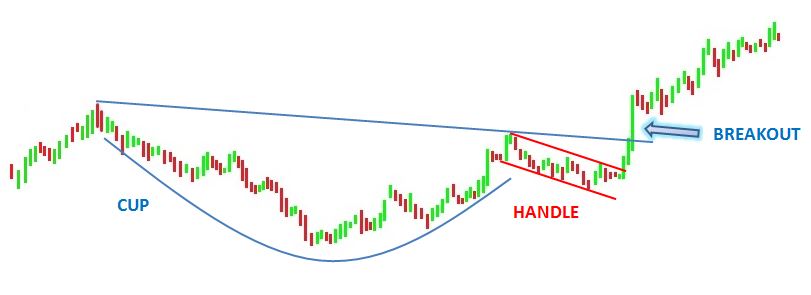
When price breaks out from the top of the cup the potential long trade can be initiated. The target of this pattern can be equal to the depth of the cup measured from the lowest point of the cup to the point of breakout. The potential failure of this pattern may occur when prices trade below the low of the handle and hence for trading, this pattern stop loss should be placed at the low of the handle to protect your trade.
I hope that through this article, you were able to understand how head and shoulder and cup & handle chart patterns form and how you should trade them with proper stop-loss and targets. If you are interested in learning more about chart patterns, then you can definitely check out my previous blog on How to Trade Wedge and Triangle Chart Patterns| Beginner’s Guide To The Stock Market | Module 13. Also, if you have any queries regarding this topic, then please post them in the comment section.
If you want to know more about Risk Management & Intraday Trading Strategies you can refer to our previous blog on
Importance Of Risk Management In Trading and 10 Best Intraday Trading Strategies.
Open a Demat Account using our link to get support from us – https://bit.ly/3gyhIWN and send your ID to [email protected]
Happy Learning!

Hello,
Thank you for giving us a very useful information and guide us. I am very inspire by you and your knowledge which gives you.
Nice technical analysis sir great
Sir when we can take entry means when we have sured that it can not be reversed so we can take entry and in which time frame. Please reply.
For intrday, you may watch the entries in market at 15 minute time frame. For Swing, 30 Minute, 1 Hour or Daily time frame is preferred based on how long you want your swing trade to be.
Hello sir I love your videos on YouTube and learned a good amount of things from them and now these blogs are teaching me a lot of things and being very helpful. Thank you for all your help.
Apn I hope you are going publish more of them soon.
Thank you, Tarun, glad that you find the blog helpful. We constantly try to bring helpful blogs for our traders and will continue doing so.