

Through this article, we are going to understand How To Trade Wedge And Triangle Chart Patterns. These are some of the most powerful and reliable chart patterns in technical analysis. So, without any delay, let us discuss every pattern one by one.
There are two types of wedge patterns, one is called a rising wedge, and the other one is called a falling wedge.
Rising Wedge Patterns are similar to symmetric triangles, but rising wedge patterns form an angle where symmetrical triangles are mostly horizontally formed. The rising Wedge pattern is formed of higher highs and lower lows which are connected with two slanted trendlines. A rising wedge acts as a bearish pattern in both uptrending and down-trending markets. These patterns are relatively hard to spot. When price trades outside the lower trendline, then potential short trade can be initiated.
Once entry is initiated, a target can be set at the lowest point in the wedge formation.
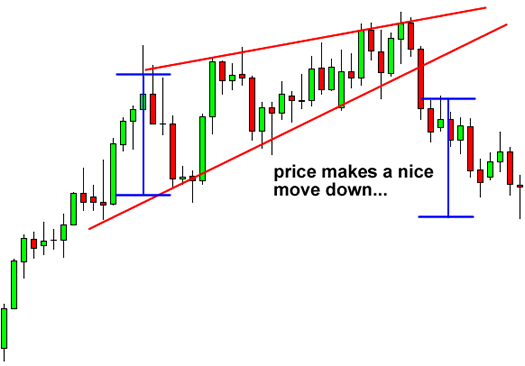
Stop-loss can be placed above the last swing high of the wedge pattern.
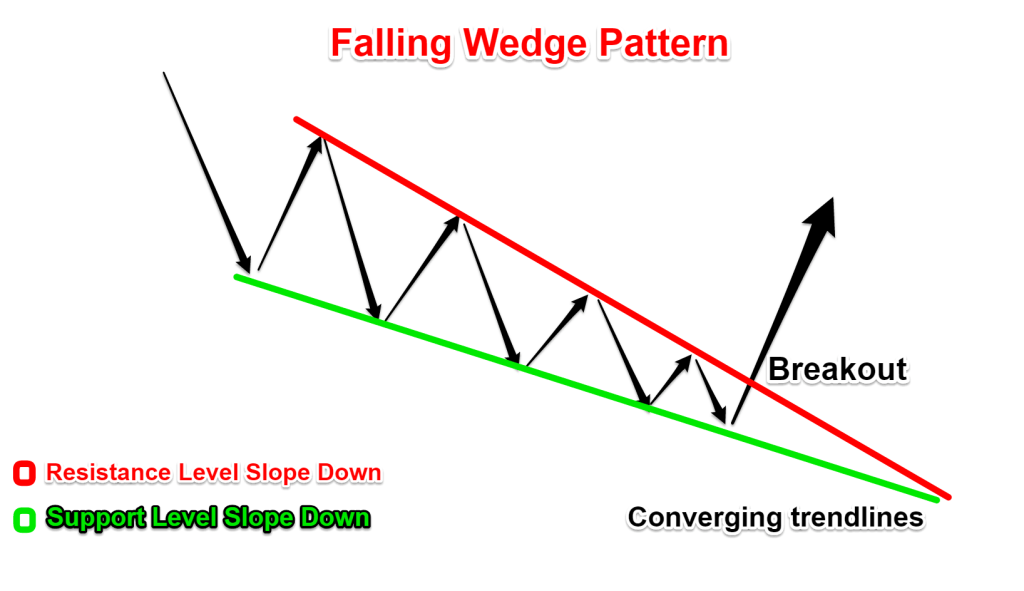
These patterns are similar to symmetric triangle patterns with a slight difference. Falling wedges are formed by connecting lower highs and lower lows with slanted lines whereas symmetrical triangles form horizontally. Falling wedge patterns are bullish patterns and indicate the power of bulls in bullish as well as bearish markets.
A breakout from the upper trendline indicates the potential long entry, but trade can only be initiated after the clear breakout. These patterns are difficult to spot as compared to other chart patterns. Targets for trading these patterns can be set at the highest swing high level of the wedge pattern.
Triangle Chart Patterns are one of the most important chart patterns in technical analysis. These chart patterns often occur on charts and can offer good risk to reward ratios.
Basically, there are three types of triangle patterns-
Trades can only be taken after clear breakouts from the trendlines. Enter trade only when there is a clear breakout/breakdown from the triangle. As I mentioned earlier, these patterns offer good rewards, most symmetrical triangles result in 100% of the depth of the entire triangle range in the direction of the respective breakout.
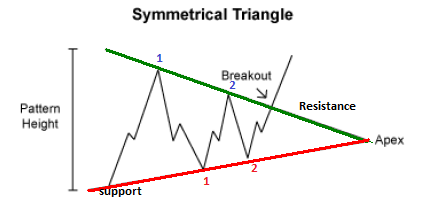
Failure of these patterns can occur when there is a false breakout or breakdown. Place a stop-loss order below major swing low for buy setup and below the major swing high for short setup.
2) Ascending Triangles
The ascending triangle is formed by two trend lines, one is a horizontal line that connects the swing highs, and the other is a slanted line that connects the higher lows. This is a bullish pattern, and it can form in any market condition. This is a quite reliable pattern.
Trade can be initiated after a clear breakout from the horizontal line. Long entry can be initiated when a candle closes above the horizontal line. Before taking the entry confirm the breakout by volume or other indicators.
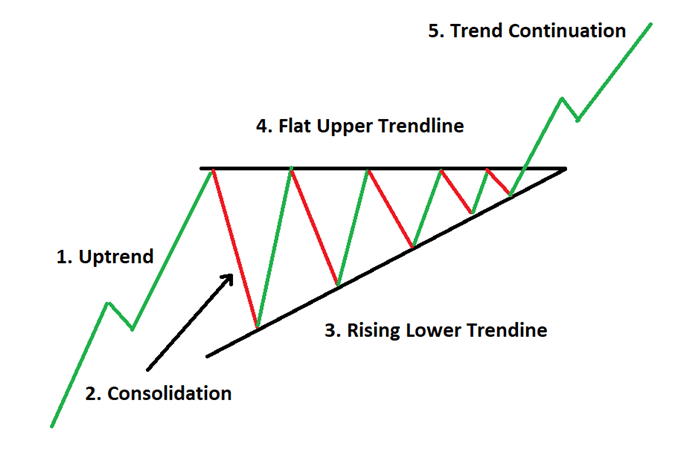
Ascending triangles have a high success rate, and the target can be set equal to the depth of the triangle. Depth is the distance between the horizontal trendline and the lowest of the upward slope trend line. Stop-loss can be set below the lower trendline.
3) Descending Triangle Pattern
These patterns are similar to ascending triangle patterns. These are bearish patterns and traded at breakdowns. Similar to the ascending triangle pattern, this pattern is formed by two trendlines, one is called a horizontal trendline that connects the swing lows, and another line is called a slanted line that connects the lower highs.
Trade can be taken after the confirmation of the breakdown from the horizontal line. Similar to ascending triangles, these are also quite reliable patterns. Before taking the entry, the breakdown should be confirmed by using volume and other indicators.
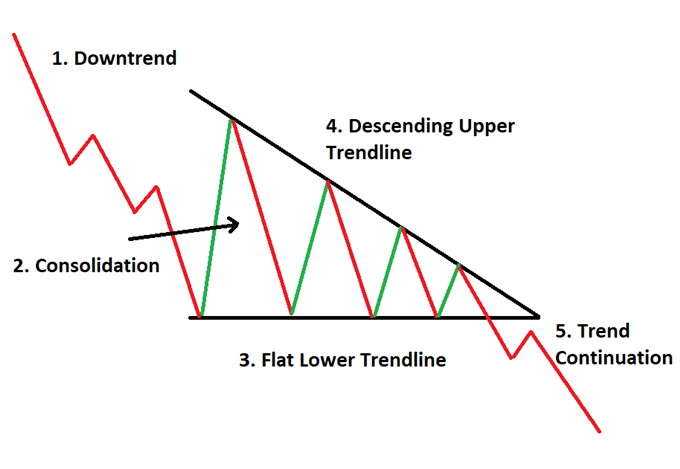
Targets can be set equal to the depth of the triangle and stop loss should be set outside the slanted trendline.
I hope through this article, I was able to explain to you how wedges and triangles chart patterns work and how you can trade them with perfect target and stop-loss. If you want to learn more chart patterns, then you can definitely check out my previous blog on How Do Double Bottom and Double Top Chart Patterns Work | Beginner’s Guide To The Stock Market | Module 12. Also, if you have any queries regarding this topic, please post them in the comment section.
If you want to know more about Risk Management & Intraday Trading Strategies you can refer to our previous blog on
Importance Of Risk Management In Trading and 10 Best Intraday Trading Strategies.
Open a Demat Account using our link to get support from us – https://bit.ly/3gyhIWN and send your ID to [email protected]
Happy Learning!

Sir are this pattern ar followed upto the apex of the triangle? Many times it is difficult to take entry when this pattern breaks early and other signals from indicator ar also not conclusive, then what to do in that situation.
Very good information.
Dear sir,
Vary vary thanks shear your knowledge and information,
I’m happy to your student,
Blessing me.
Thank you, Manab, glad that you find the blog helpful.
Mostly yes it follows upto the apex but u have to be carefull about fake break outs because it seems like the triangle pattern was successful but it suddenly retest and breaks the pattern.
So be sure of that the pattern is followed correctly.
Very informative