

As we have discussed earlier, Candlestick Chart represents the price movement of a stock over a certain time. This type of chart is quite popular among traders because they are easy to read and understand. types of candlestick patterns Bearish Engulfing, Dragonfly Doji
And to understand Candlestick Charts we need to understand the types of candlestick formed by the movement of the stocks. We will also discuss what does the pattern signifies and what pattern could be more useful and profitable in different situations.
Are you ready to dig deep into the Stock Market?
Let’s Go.
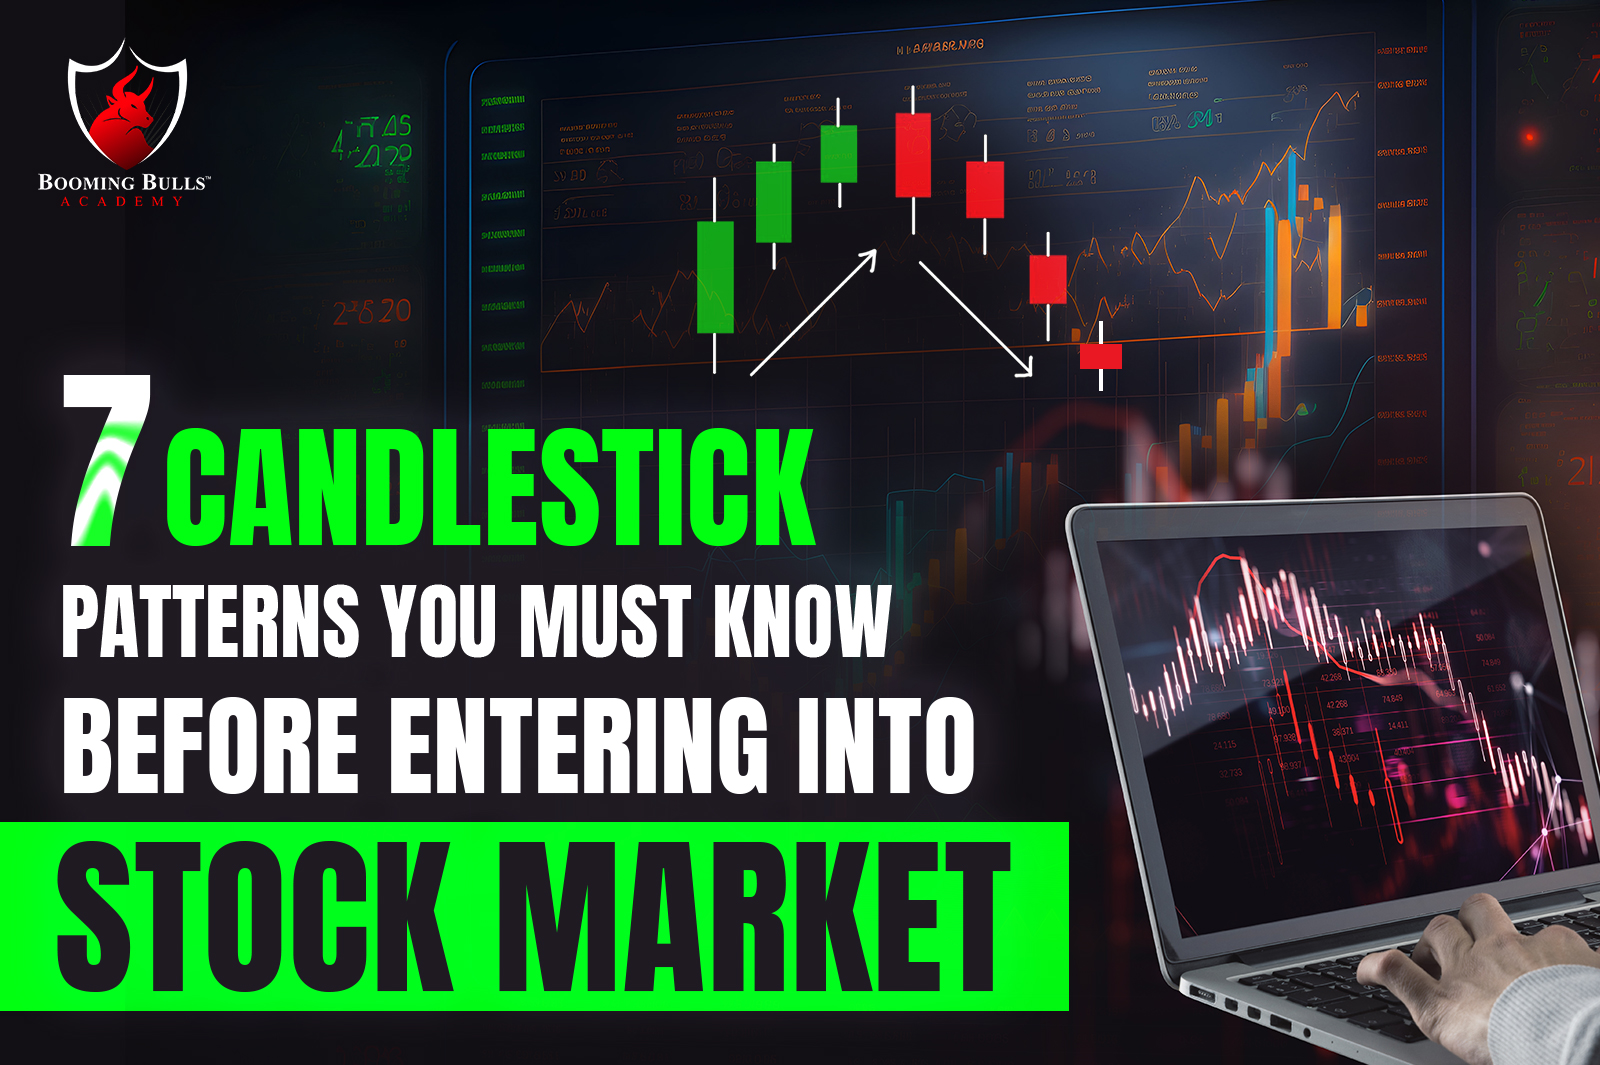
Candlestick chart has 7 different types of forms made by a stock. If you want to invest and to book big profits, it is necessary to know about these candlestick formations. Below are the description and significance of the candlestick formations.
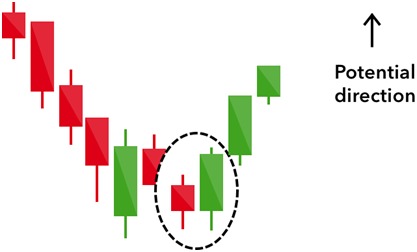
The bullish engulfing pattern is formed of two candlesticks. The first candle is a short red body that is completely engulfed by a larger green candle. types of candlestick patterns
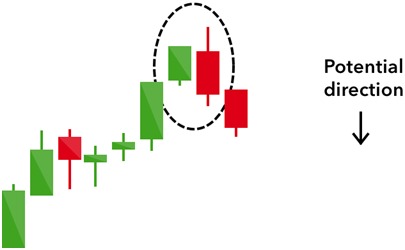
A bearish engulfing pattern occurs at the end of an uptrend. The first candle has a small green body that is engulfed by a subsequent long red candle. types of candlestick patterns
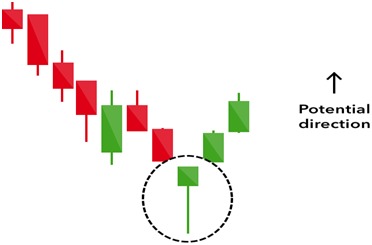
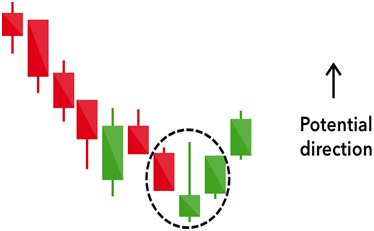
The hammer candlestick pattern is formed of a short body with a long lower wick and is found at the bottom of a downward trend. A hammer shows that although there were selling pressures during the day, ultimately a strong buying pressure drove the price back up. The color of the body can vary, but green hammers indicate a stronger bull market than red hammers.
A similarly bullish pattern is the inverted hammer. The only difference being that the upper wick is long, while the lower wick is short. It indicates a buying pressure, followed by a selling pressure that was not strong enough to drive the market price down. The inverse hammer suggests that buyers will soon have control of the market.
A Standard Doji is a single candlestick that does not signify much on its own. To understand what this candlestick means, traders observe the prior price action building up to the Doji. types of candlestick patterns

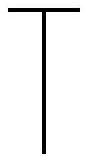
The Dragonfly Doji can appear at either the top of an uptrend or the bottom of a downtrend and signals the potential for a change in direction. There is no line above the horizontal bar which creates a ‘T’ shape and signifies that prices did not move above the opening price. A very extended lower wick on this Doji at the bottom of a bearish move is a very bullish signal
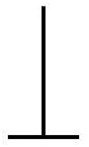
The Gravestone Doji is the opposite of the Dragonfly Doji. It appears when price action opens and closes at the lower end of the trading range. After the candle open, buyers were able to push the price up but by the close, they were not able to sustain the bullish momentum. At the top of a move to the upside, this is a bearish signal.
Candlestick’s pattern of analyzing the market is completely based on the formations made by a stock. And based on these formations the best point of investment and the prediction of stock can be easily interpreted. Each pattern has its own meaning and they do provide really important information about the upcoming movements of the stock.
In our upcoming blog, we will be talking about the Support and Resistance in the Stock Market. In case you have any queries regarding the Candlestick patterns, kindly leave your comment below and we will reply to your questions
You can also read :
What is Candlestick Chart & Analysis in Stock Market?
If you want to know more about Risk Management & Intraday Trading Strategies you can refer to our previous blog on
Importance Of Risk Management In Trading and 10 Best Intraday Trading Strategies.
Open a Demat Account using our link to get support from us – https://bit.ly/3gyhIWN and send your ID to [email protected]
Happy Learning!

I found this post educating, thanks I anticipate more of such articles.
THANKS
Sir chart me hammer petan red or green dono bullish hota hai mene chart me dekha hai kabhi bullish hota hai kabhi bearish hota hai so me thoda confused hu
very informative thank you for sharing this.
pl.explaine how to find stop loss
Watch this video: https://www.youtube.com/watch?v=_Xm8fIBDiRU