

Indicators and Oscillators are used to determine the direction of the trend. They play a very important role in analysing the markets as each indicator and oscillator gives us important information regarding price, volume, momentum, etc. Hence, it is important to study the different oscillators and indicators in order to improve your technical skills.
Before going into a discussion of this topic, it is important to understand the difference between indicators and oscillators as they are not the same and play different roles in technical analysis.
As the name suggests indicators are used to indicate the potential direction of the trend, indicators are considered very useful tools in technical analysis as they give an idea about the potential direction of the trend.
On the other hand, an oscillator is a tool that oscillates between two boundaries and gives an idea about the momentum of the market. For example, if the market is in the overbought zone, then the oscillator will oscillate at its upper boundary and if the market is in the oversold zone then the oscillator will oscillate at the lower levels.
There are numerous indicators available in the market, of course, all indicators are not important for trading. Often, many traders ask me about which indicators we should use for improving our trading performance but there is no specific answer for this question. Trading is a very personal thing, things that work for me may not work for you and vice-versa.
Similarly, indicators that I use may not show that much efficiency in your trading system, hence, you have to find which indicators suit you and your trading style and according to that, you have to take the actions.
Here are 2 most famous indicators that are generally used by many traders-
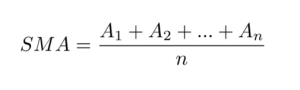
The formula for calculating the simple moving average is as follows=
A = Prices of that underlying at that particular stock
N = Number of days for which you want to calculate the moving average.
For example,
If you want to calculate the 200-day moving average on a 15 min time-frame then you have to take the closing price of the last 200, 15-min candles, and simply divide it by 200 in this way you will get 200-ema. Anyways, you don’t have to do these calculations, everything will be available on TradingView with just a few clicks.
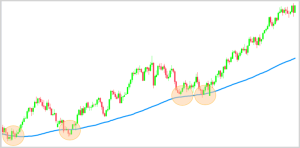
Now let’s see the practical example of Moving Averages acting as support and resistance–
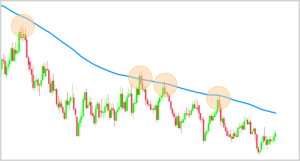
In the above example, the stock is consistently taking support from the moving average line and rallying upside, now let’s see the example where the moving average acts as a resistance.
As we can see in the above example, the stock is consistently taking resistance from the moving average and rallying downside indicating the bearish trend in the market.
A Fibonacci number is a series of numbers in which each Fibonacci number is obtained by adding the two previous numbers. It means that the next number in the series is the addition of two previous numbers.
For example, suppose the first two numbers in the series are taken as 0 and 1. By adding 0 and 1, we get the third number as 1. Then by adding the second and the third number (i.e) 1 and 1, we get the fourth number as 2, and similarly, the process goes on. Thus, we get the Fibonacci series as 0, 1, 1, 2, 3, 5, 8, ……. Hence, the obtained series is called the Fibonacci number series. This is the basic concept behind Fibonacci numbers.
Now, let’s see the practical example of the Fibonacci retracement tool:
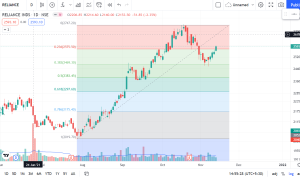
For placing the Fibonacci Retracement tool on the charts identify the lowest point and the highest point and join them. After joining these points you will automatically see fib ratios on your charts. These fib ratios are 1,0.786,0.618,0.5,0.382,0.236 and 0.
Now, the terminology for using this tool is whenever a stock takes the pullback then it is a high probability that the stock will take support at the above-mentioned levels and start a new rally from there. In the above example, we can see that after taking resistance from the above levels reliance made a pullback and if we analyse it with Fib retracement then it is clearly visible that the reliance has taken a support at 0.3 fib level and started the new rally from there.
Like Indicators there are numerous Oscillators available in the market, of course, all oscillators are not important for trading. Oscillators are generally used along with other technical indicators to make the right trading decisions.
Oscillators play the most important role when there is no clear direction in the market i.e when the market is sideways. When the market is near its support, oscillators will be in the oversold zone indicating potential bullish trade and when the market is near its resistance then oscillators will be in an oversold zone indicating potential bearish trade. That being said, you can’t entirely rely on oscillators, you have to use price action and other indicators to support your view on the market.
Here are the 2 most important oscillators that many traders use-
RSI measures the speed of change of price movement. Basically, it tells us about the momentum of the market,i.e whether the momentum is strong or whether it is weak, etc. RSI oscillates between 0 to 100 and is considered overbought when it is above 70 and oversold when it is below 30.
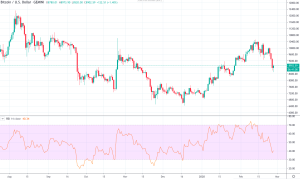
As shown in the figure, when RSI is below 30 stock is at the support zone and when RSI goes above 70, we can say that the stock is in the overbought zone. Also, when the stock goes in one direction and RSI goes in another direction then we say that there is RSI Divergence that I will explain to you in brief in the upcoming blog.
Just like RSI, a stochastic oscillator can also be used for knowing the strength of the momentum. A Stochastic Oscillator is made up of two lines that oscillate between and around two horizontal lines. The fast-moving line is called the %k line which is calculated based on a specific formula and the other line is made up of a 3-day moving average of the %k line.
A Stochastic Oscillator is used to identify the oversold and overbought zone. When stochastic is above 80 then we can say that the stock is in the overbought zone and when stock is below 20 then we can say that the stock is in the oversold zone. However, these are not always reliable interpretations; very strong trends can maintain overbought or oversold conditions for a long period. Instead, rather you should look at the changes in the Stochastic Oscillator for getting ideas about the potential future trend shifts.
I hope through this article, I was able to explain to you what the indicators and oscillators are and how they work. If you have any queries regarding this topic, please post them in the comment section.
If you want to know more about Risk Management & Intraday Trading Strategies you can refer to our previous blog on
Importance Of Risk Management In Trading and 10 Best Intraday Trading Strategies.
Open a Demat Account using our link to get support from us – https://bit.ly/3gyhIWN and send your ID to [email protected]
Happy Learning!

Very useful information thank you Anish sir
Very nice information sir.
Thank you ??
Nice info