Last week we learned about the “TOP INDICATORS ONE SHOULD KEEP AN EYE ON” where we discussed about the best indicators. As now that you are aware of the best indicators you should also lookout for the best oscillators in the stock market.
So, today we are going to discuss about the best oscillators in the stock market that can help you book big profits if interpreted correctly.
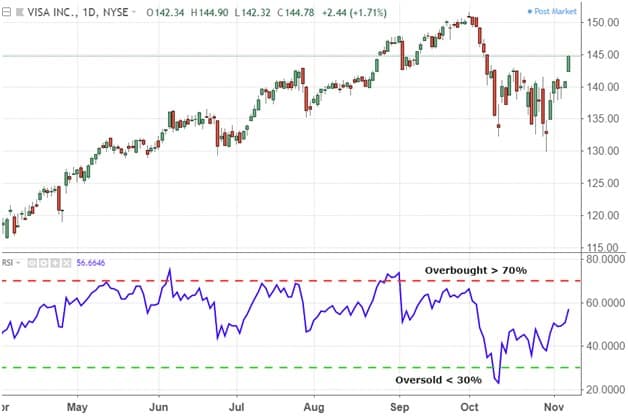
Relative Strength Index(RSI)
The relative strength index (RSI) is a momentum indicator that measures the magnitude of recent price changes to evaluate overbought or oversold conditions in the price of a stock or other asset.
The RSI compares bullish and bearish price momentum plotted against the graph of an asset’s price.
Signals are considered overbought when the indicator is above 70%and oversold when the indicator is below30%.
The RSI will rise as the number and size of positive closes increase, and it will fall as the number and size of losses increase.
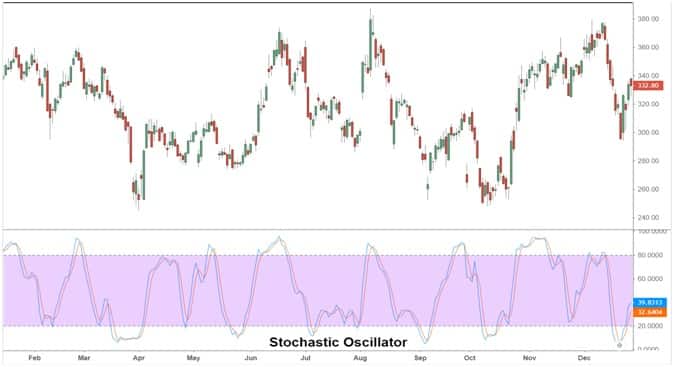
Stochastic
A stochastic oscillator is a momentum indicator comparing a particular closing price of a security to a range of its prices over a certain time.
The sensitivity of the oscillator to market movements is reducible by adjusting that time or by taking a moving average of the result.
It is used to generate overbought and oversold trading signals, utilizing a 0- 100 bounded range of values.
Stochastic oscillators are sensitive to momentum rather than absolute price.
Traditionally, readings over 80 are considered in the overbought range, and readings under 20 are considered oversold.
Average Directional Indicator (ADX)
ADX is used to quantify trend strength.
ADX calculations are based on a moving average of price range expansion over a given period of time.
The default setting is 14 bars, although other time period can be used.
ADX is plotted as a single line with values ranging from a low of zero to a high of 100.
ADX is non-directional; it registers trend strength whether the price is trending up or down.
The indicator is usually plotted in the same window as the two directional movement indicator (DMI) lines, from which ADX is derived
When the +DMI is above the -DMI, prices are moving up, and ADX measures the strength of the uptrend.
When the -DMI is above the +DMI, prices are moving down, and ADX measures the strength of the downtrend.
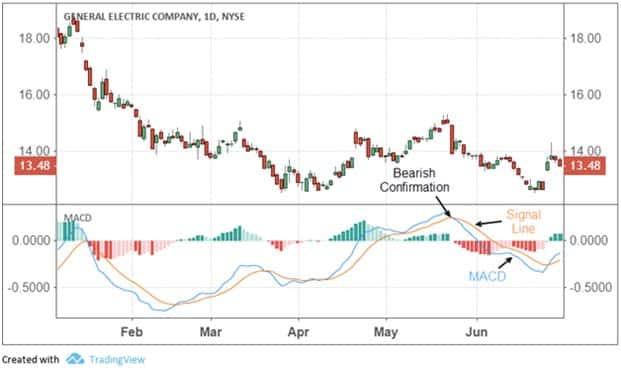
Moving Average Convergence and Diversions(MACD)
Moving Average Convergence Divergence (MACD) is a trend-following momentum indicator that shows the relationship between two moving averages of a security’s price.
MACD is calculated by subtracting the 26-period EMA from the 12-period EMA.
MACD triggers technical signals when it crosses above (to buy) or below(to sell) its signal line.
The speed of crossovers is also taken as a signal of a market is overbought or oversold.
MACD helps investors understand whether the bullish or bearish movement in the price is strengthening or weakening.
MACD is often displayed with a histogram that graphs the distance between the MACD and its signal line.
These are the few oscillators that you should know before you start trading. These are the points that can help you book huge profits from time to time. These are the points that will always keep a trader on the right path of investments.
Sir ji your videos are very helpful & understandabIe to me .
How I will become very good trader whether by reading books or by YouTube videos or by joining class


Sir ji your videos are very helpful & understandabIe to me .
How I will become very good trader whether by reading books or by YouTube videos or by joining class