


Knowing How to Read the Stock Charts is very much important when it comes to mastering technical analysis. Through the Beginner’s guide to the Stock Market series, we have covered some basic and important topics like candlesticks, introduction to technical analysis, etc. Now, we are going to cover the most important topic, which is How to Read the Stock Charts and Understand the Market Trends.
As we know, charts represent the psychology of the market as they represent the price data at various time intervals, and hence, every trader or investor should have the basic knowledge of reading charts for a proper understanding of the market structure and trend.
Now, I will tell you the right step by step process of analysing the charts-
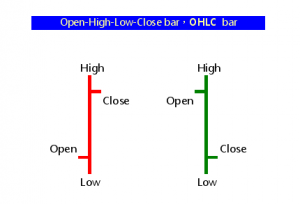
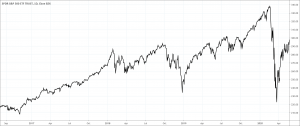
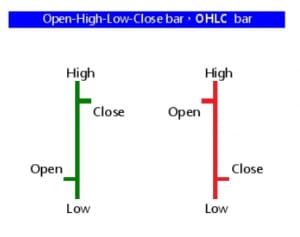
As we discussed in earlier lessons, there are various types of chart patterns such as candlesticks, bars, lines, areas, baselines, etc. Here are some commonly used chart styles-
 In case, if you don’t know what is candlestick chart pattern then, you can check out 4 Most Important Things to Know About Candlesticks | Beginner’s Guide to Stock Market | Module 07 in which I have explained to you everything regarding candlestick patterns.
If you want to analyse stock charts in a perfect manner then you should understand the timeframes very deeply. There are various time frames present, through which we can analyse the stocks.
Some important time frames –
Depending upon your trading style, you have to use different time frames. For example, for intraday trading mostly traders use 5 and 15-minute timeframes. Also, for swing trading, 1 hour and 1-day time frame can be used. For investing and getting a broader view of the market you can use a 1-month and 1-week timeframe.
There is no specific rule for using any particular time frame, it totally depends on your comfort level and trading style.
1) Know the support, resistance, and trendlines-
One of the most important skills in chart reading is the identification of proper support and resistance levels. By marking important levels on the chart, you can know the area of interest at which many buyers or sellers will become active and according to that data, you can plan your trades.
Along with horizontal support and resistance levels, trendlines also play a significant role by representing a strong uptrend or downtrend in the market. In a Bullish Market, traders tend to buy at the support or near the trendline and in a bearish market, traders look for the sell entry when the stock is near to the trendline.
Understanding market trends is very much important for trading as well as investing. Now, for understanding market trends there are various ways through which you can know the current market trend.
After getting the idea about a broader view of the market, then you can come to smaller time frames to know the short-term trend of the market and to plan potential entries and exits. This will give you a clear idea about short-term as well as long-term trends. It is important to understand that whenever you get to know about short-term and long-term trends then it is always favorable to trade with the long-term trend because, in the majority of cases, the long-term trend is more convincing than the short-term trend.
When it comes to reading the stock chart, there is no specific method or technique available in the market by which you can read the stock chart and make guaranteed profits. Every trader has his own way of analysing charts. No one can tell you that this is the only and right way to analyse the stock charts because it depends upon your trading style and comfort level.
As you practice more, you will develop your own method of analysing the charts and as you trade more and more, you will develop your own system with an edge that will make consistent profits for years but for that, you need a lot of patience and hard work. In case, if you did not get what is meant by a trading system then you need not have to worry, I will cover everything in the upcoming blogs of
Beginner’s Guide to the Stock Market Series. I hope, after reading this article, you got an idea of how one can read the stock charts through different methods. Also, if you have any doubt regarding this topic, please post it in the comment section.
If you want to know more about Risk Management & Intraday Trading Strategies you can refer to our previous blog on
Importance Of Risk Management In Trading and 10 Best Intraday Trading Strategies.
Open a Demat Account using our link to get support from us – https://bit.ly/3gyhIWN and send your ID to [email protected]
Happy Learning!

So nice blog
….really I read….all sentence…carefully
Your doing a great job love you sir
Your doing a great job love you sir ?
One of the Best ❣ & your a magical? sir..?
Your learning style is awesome.. Bcz it’s easy to understand..!
I am following you from 6months & I changed my trading style in right ways✌️
Also I like most you bcz of your nature✨??
Thank you, Kunal, glad that you find the blog helpful. We constantly try to bring helpful blogs for our traders and will continue doing so.
Nice and easy explainatiin