

Support and resistance are important aspects of technical analysis. They give important information to investors or traders regarding trends as well as reversals, and hence, in today’s lesson, we are going to Understand Support and Resistance in 5 Easy Steps.
Before understanding support and resistance, it is important to know that support and resistances can be used in different ways such as, they can be used to determine the reversal of the trends, or they can be used to determine potential targets, stop-losses, etc. Also, there are different types of support and resistance that we will discuss in today’s topic.
In technical terms, support is the area of the chart where the numbers of buyers are more than the number of sellers. In other words, support is something that prevents the price from going down.
As I mentioned above, at the support zone, the number of buyers is more than the number of sellers, and hence the price of the stock goes up. When the price of the stock falls and touches the support, it is likely to bounce back from there. Support often acts as an indication to buy. One more important thing that we should understand here is that support is always located below the current market price.
On the other hand, it is also possible that the price can break the support and fall further. It is not a rule that if stock is at its support level, then, it has to go up in the direction. But there is the maximum possibility that the price of the stock could fall until the support, consolidate, absorb all the buy orders, and then start going up.
Here is the example of the support on the charts-
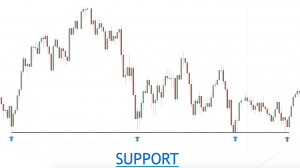
As we can see in the above figure, the price of the stock falls initially, which indicates the power of bears, and at the particular point, the buyers become more active than sellers, and hence, the stock price moves up. Generally, Bullish Engulfing or pin bar pattern is formed at the support which indicates strong buying at the support line.
One more important thing we should notice here is that, if the price of the stock can go below the support line for a short interval of time forming the wick of the candle, but in the end, the closing of the candle is more important than the wick of the candle. If the candle closes below the support line, then we can say that the support is broken.
As the name indicates, resistance is something that prevents the price from going high. In technical terms, resistance is the area of the chart where the number of sellers is more than the number of buyers, and hence, the price of the stock dips.
The resistance often acts as an indicator to sell. When the price of the stock touches resistances from below, it is likely to reverse from there. One more important point we should understand here is resistance is always located above the current market price.
On the other hand, it is also possible that the stock may break the resistance and keep going upwards, more the number of touches to a resistance or support, higher is the probability of breaking that particular resistance or support.
Here is the example of resistance on the charts-
As we can observe in this figure, the price of the stock surges at the beginning with strong green candles which eventually indicates the power of bulls in the market. But after touching the resistance line, the sellers become more active than the buyers, and the stock price plunges. Generally, a Bearish engulfing, inverted hammer or evening star pattern is formed at the top which indicates a potential trend reversal.
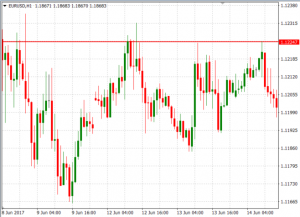
In technical analysis, when the stock comes back to previous levels, broken support acts as resistance and broken resistance acts as support for the stock..
As we draw a horizontal line or trendlines to draw a support or resistance, along with horizontal lines moving averages can also be used to determine the support and resistance.
For example,
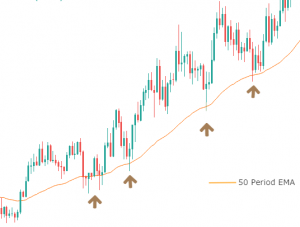
As shown in the above figure, the stock is continuously taking support from its 50-day EMA. The stronger the moving average, the stronger is the support. For example, a 200-day EMA acts as stronger support or resistance than a 50-day EMA.
In the same way, the bigger the time frame is, the more effective will be the support or resistance of the moving averages. For example, 200-day EMA on a one-day time frame is stronger resistance/support than a 200-day EMA on a 15 mins time frame.
Now, let’s see the example of moving average acting as a resistance-
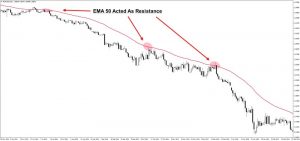
As we can see in the above figure, the stock is continuously dipping after touching its 50- EMA. Here, we can say the 50-day EMA is acting as crucial resistance for this stock.
As I mentioned above, broken support acts as a resistance when the stock comes back to previous levels, and broken resistance acts as the support for the stock. The same concept applies in moving averages as well. If any stock breaks the resistance of any moving average, then next time the same moving average will act as support for that particular stock and vice-versa.
Many traders use support and resistance for different purposes. Some traders use them for taking entries in the stock. Some use them to place stop-losses, some use them to determine potential targets for that trade.
Support and resistances are widely used to take the entries in the trades. Many traders buy the stock at the support when a buy signal is given by their trading system, and sell it at the resistance. Along with this, support and resistance are used to trade breakouts and breakdowns. When any stock breaks its resistance, then buy entry is initiated, and when any stock breaks its support and closes below it, then the sell entry is initiated.
One more important use of support and resistance is to determine stop-losses and targets. Normally, traders place their stop-loss below the support, if they want to buy that stock and above the resistance if they want to sell it. Targets are placed just below the resistance of that particular stock for a buy position and above the support of that stock for a short position.
I hope, through this article, you were able to understand the Concept of Support and resistance. If you are interested in learning more about technical analysis, then you can definitely check out “Beginner’s Guide to the Stock Market | Module 07 | Top 4 Important Things to Know About Candlesticks.”. Also, if you have any queries regarding this topic, please post them in the comment section.
If you want to know more about Risk Management & Intraday Trading Strategies you can refer to our previous blog on
Importance Of Risk Management In Trading and 10 Best Intraday Trading Strategies.
Open a Demat Account using our link to get support from us – https://bit.ly/3gyhIWN and send your ID to [email protected]
Happy Learning!

Thank You
You are a great tutor sir, your rule of explaining much better than others I have watched so many video from many Trainor but no one like you. I personally learn a lot from you and I recommend everyone to your video and blogs.
Thank you, Rupesh, glad that you find the blog helpful.
You are a great tutor sir, your rule of explaining much better than others I have watched so many video from many Trainor but no one like you. I personally learn a lot from you and I recommend everyone to your video and blogs those who want to learn about share market.
Thank you, Rupesh, glad that you find the blog helpful.
I want to learn technical analysis
Give us a call on this number for course details +91-8130245100
9 AM to 9 PM: Working Hours
Very nicely explained.
Great Content…
Learn so many things from Booming Bulls.
Great Content ✌️