

Technical Analysis is one of the most significant terms in trading, and through this article, I am going to explain to you the basics of Technical Analysis in 3 simple steps. Technical Analysis is the way through which you can understand the behavior of the market by analysing charts. So, before understanding the basics of technical analysis, you should know-
As we discussed above, Technical Analysis is the tool for analysing the behavior of the market. Generally, we analyse the behavior of the market with the help of chart patterns. A chart pattern is nothing but a representation of historical data in a systematic way on the charts.
As we try to understand the business model, growth, and other important financial ratios in fundamental analysis for long-term investment. Here, in the Technical Analysis, we try to study the chart of that particular company to predict the future price action.
Technical Analysis believes that the last trading price is the most reliable indicator in the market that is why we say “price is the god in the Stock market.”
All the indicators such as Moving Averages, Relative Strength Index, Bollinger Bands, etc. are made from price and volume because in Technical Analysis we only study the behaviour of price and volume on different time frames.
As we discussed above, technical analysis analyses charts and for analysing the charts traders use different time frames. Time frame is an entire big chapter in itself, but in this lesson, I will give you the basic idea of time frames and how and why we use them.
Basically, traders use some common time frames for analysing the charts, and those time frames are-
Now a selection of the particular time frame for trading depends upon the trader’s personal trading style. Generally, if you are doing Intraday Trading, then many traders use a 5 min and 15 min time frame. If you are looking for Positional Trade and want to hold your trade for some days or weeks, then that trader can use a 1-hour and 1-day timeframe for analysing the stock.
Now, if you are an investor and want to hold the stock for years, then you can use a 1- week and 1-month timeframe for analysing the stock. Always use multiple time frames for analysis that will help you to know the long-term as well as the short-term trend of the market.
There are a lot of indicators in technical analysis, and one common thing amongst them is they all are derived from the study of price and volume. Every indicator you use is either a combination of these two or individually derived from these factors.
Here are some important indicators-
Moving Averages- It is the technical indicator derived from price. It adds the price of the particular stock on a particular time frame and divides it by the number of data points to arrive at an average.
There are four types of moving average-
Simple Moving Average– As we discussed above, It adds the price of the particular stock on a particular time frame and divides it by the number of data points to arrive at an average.
For example, if you want to calculate a 200 days simple moving average in a daily time frame, then it will consider the most recent 200 candles and add them (closing or opening price depending upon your preference) after that, the sum will be divided by 200 to calculate 200-day moving average. Similarly, you can use different moving averages on different time frames.
Mathematically,
Exponential Moving Average– Exponential Moving Average is slightly different and effective than SMA. It gives importance to the most recent data as compared to SMA.
In other, In EMA, first, Simple Moving Average is calculated, and then multiplier for weighting the EMA (referred to as the “smoothing factor”) is calculated. Which is having the formula: [2/(selected time period + 1)]
For example, for 200 EMA the multiplier would be [2/(200+1)]= 0.009952. Mathematically,
EMA=Price(today)×k+EMA(yesterday)×(1−k)
where: k=2÷(N+1)
Generally, EMA is more reliable than SMA as it gives more importance to the most recent data.
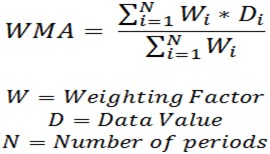
Weighted Moving Average – Similar to EMA, weighted moving average gives more importance to the most recent data and gives less weightage to the past information. In WMA, all the data points are considered which is reflected in a weight assigned to it.
Mathematically,
Displaced Moving Average- It is just like a regular moving average which is displaced by a certain amount of period. It has been adjusted forward or back in time for the better forecasting of trends.
Basically, the high value of RSI indicates an overbought zone, and the low RSI indicates an oversold zone in the stock.
MACD helps investors and traders by indicating whether the bullish or bearish movement in the price of the stock is strengthening or weakening.
This is the most important aspect when it comes to analysing a particular stock.
In a top-down approach first trader or investor analyse the broader view of the economy, sector, and stock. Generally, the trader who wants to hold his trader for the short term goes with a top-down approach. Also, through this approach, the trader will first analyse the stock with higher time frames, and then he will come to lower time frames.
On the other hand, in the bottom-up approach, a trader or investor focuses on the particular stock and not on a broader view of the economy or that particular sector. In this approach, investors assume that the stock will perform better than the sector or an economy hence, he analyses the financials of the company, along with other technical indicators, and takes his final decision.
I hope, through this article, I was able to explain to you what technical analysis is and some basics of technical analysis. If you are interested in knowing more about the Basics of the Stock Market, then do check out our previous blog of the series, “Beginner’s Guide to The Stock Market || Module 05|| Sectors in The Stock Market That You Should Know.” Also, if you have any queries regarding this topic, please post them in the comment section.
If you want to know more about Risk Management & Intraday Trading Strategies you can refer to our previous blog on
Importance Of Risk Management In Trading and 10 Best Intraday Trading Strategies.
Open a Demat Account using our link to get support from us – https://bit.ly/3gyhIWN and send your ID to [email protected]
Happy Learning!

I am interested to learn can u reach me out and tell me about the charges and fees structure
Hello Akash, Feel free to contact us at this number: + 91 81302-45100
Let me know all about tech analysis
???
Great information sir I really like to take small losses with sl and like to improve waiting for that
Yes
I wanna know about technical analysis coz I am making just silly mistakes while trading?
Give us a call on this number for course details +91-8130245100
9 AM to 9 PM: Working Hours
I wants to join this package. Plz send me details.
Give us a call on this number for details +91-8130245100
9 AM to 9 PM: Working Hours
If you could not connect on this number then kindly fill the form here: https://boomingbulls.com/elite-trader-program-register/ and then our team will call you as soon as possible.
Want to join this
Give us a call on this number for details +91-8130245100
9 AM to 9 PM: Working Hours
If you could not connect on this number then kindly fill the form here: https://boomingbulls.com/elite-trader-program-register/ and then our team will call you as soon as possible.
Please tell how much is the fee for beginners
Give us a call on this number for details +91-8130245100
9 AM to 9 PM: Working Hours
If you could not connect on this number then kindly fill the form here: https://boomingbulls.com/elite-trader-program-register/ and then our team will call you as soon as possible.
I’m interested
Give us a call on this number for details +91-8130245100
9 AM to 9 PM: Working Hours
If you could not connect on this number then kindly fill the form here: https://boomingbulls.com/elite-trader-program-register/ and then our team will call you as soon as possible.
I want to join this peckage pls send me details .
Give us a call on this number for details +91-8130245100
9 AM to 9 PM: Working Hours
If you could not connect on this number then kindly fill the form here: https://boomingbulls.com/elite-trader-program-register/ and then our team will call you as soon as possible.