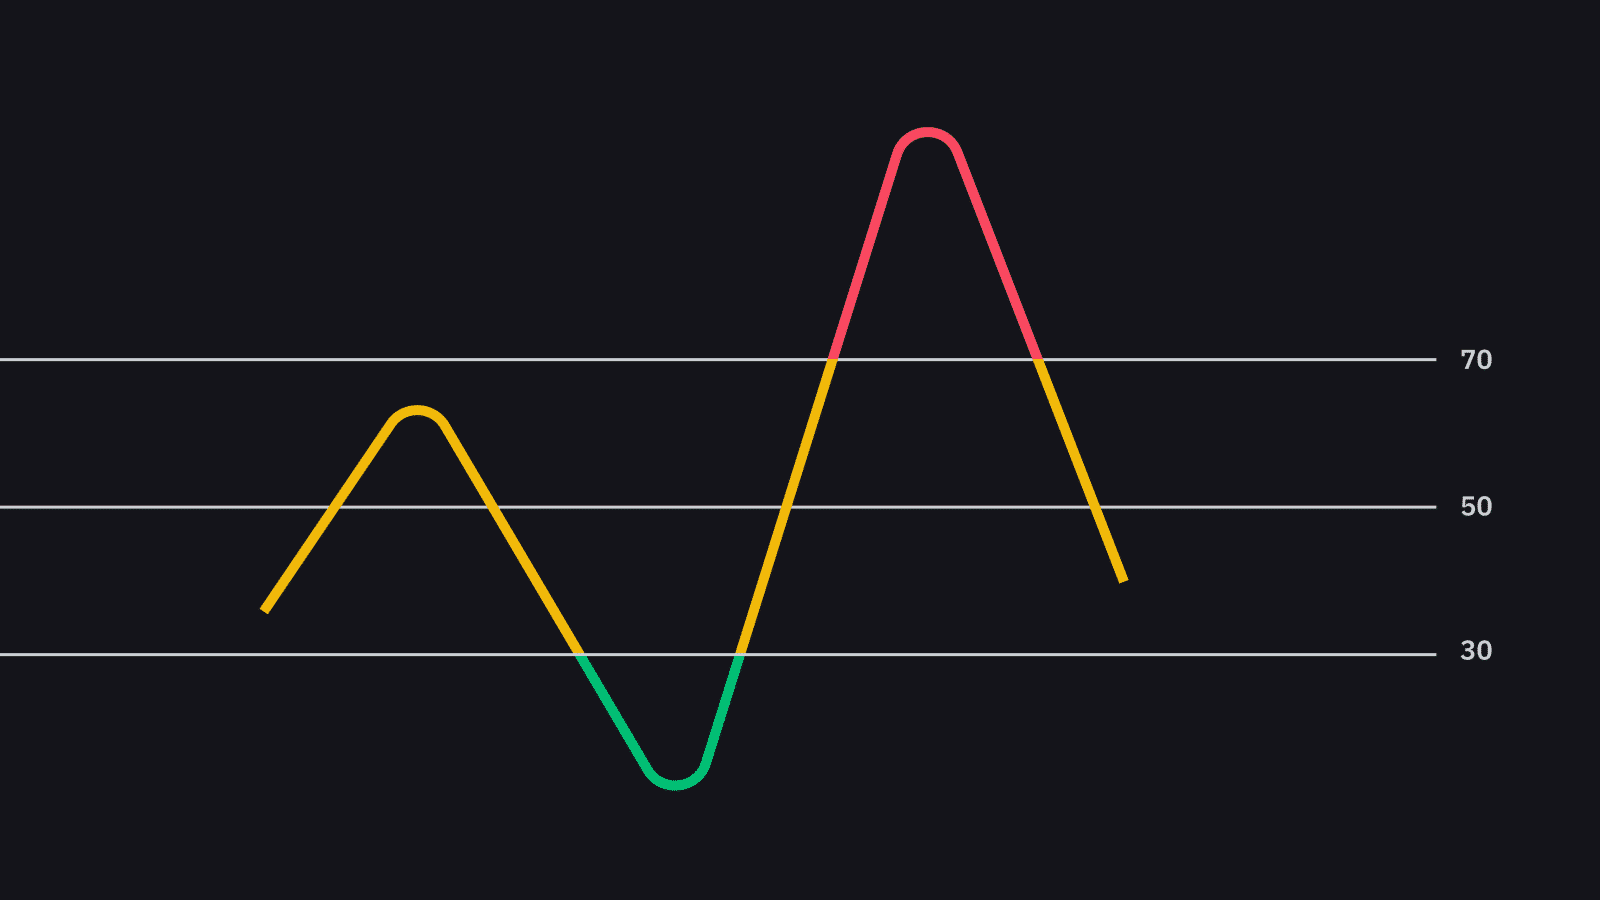

In the previous blog we discussed about the RSI Intraday Strategy | Best Indicator for Intraday and proceeding further today we will discuss about some key indicators that will provide you information on the RSI indicator if they are taking support or resistance or if they will breakout.
These indicators can help you to increase the chances of booking big profits. Starting with the Gap-Up and Gap-Down theory, we will further discuss the specifications that define the “Breakout & Breakdown” with “ Reversal”.
Breakout and Breakdown |
Reversal |
| RSI giving a breakout | RSI took support or resistance |
| ADX Rising | ADX Rising |
| No crossover on MACD | Reverse crossover on MACD |
| EMA levels breakout | EMA levels act as Supp or Resist. |
| Trend lines breaking | Trend lines act as Supp or Resist. |
These were some of the key indicators that will provide you information on the RSI indicator. Keeping these indicators in mind, no one can face difficulty on recognising the Breakout or Breakdown point or the Reversal point by the RSI Indicators.
Hope you enjoyed learning the Key Indicators which can help in recognizing the Support or Resistance of RSI Indicators.
Check out our new video on Intraday Trading Setup by Anish Singh Thakur | Trading Nifty | BankNifty Options | Best Trade Setup on Youtube.
Also check out our video on KNOW ABOUT THE STOCK MARKET FROM BASIC TO ADVANCED
If you are new to trading and want to learn about stock market from scratch please check our video on “BASICS OF STOCK MARKET” here.
If you want to know more about Risk Management & Intraday Trading Strategies you can refer to our previous blog on
Importance Of Risk Management In Trading and 10 Best Intraday Trading Strategies.
Open a Demat Account using our link to get support from us – https://bit.ly/3gyhIWN and send your ID to [email protected]
Happy Learning!
I want to inquire about the course. Please ur email me ur details
you work is very and helped to bost motivartion , i have empty my fund but still learning and makeing money
Good morning team booming bulls.
I have a doubt plz clear it.
1- For Gap up example- opening price for today is high for previous day last candle high or previous day high.
2-For Gap Down example- opening price for today is low for previou day last candle low or previou day low.
Plz resolve my doubt.
ThanKing all of you.
Gap-Up or Gap-Down means if todays opening price is higher/lower than previous days closing price with no trading activity in between.