

Average True Range Indicator is the indicator used in Technical Analysis to measure the market’s volatility. The ATR was introduced by technical analyst J. Welles Wilder Jr. in his book named New Concepts in Technical Trading Systems. Through this article, we will see how exactly ATR works and its significance, and most importantly, how we can use it to enhance our profitability in trading.
ATR is made to measure the volatility in the market, and ATR is basically an average of true ranges over a specified period. ATR measures the volatility and also considers any gaps between price movement.
An increasing ATR indicates the high volatility in the market, and decreasing ATR indicates a decrease in volatility in the market. One more important thing to note is that ATR is not a directional index, so suppose a reversal in price with an increase in ATR would potentially mean there is a strength behind that particular move. A sharp rise in ATR is the result of wild moves, and there is less chance of sustaining high ATR values for a more extended period.
ATR with low values indicates the narrow range in the market and low volatility. A more extended period of low ATR values may indicate a consolidation area and a potential breakout in either direction.
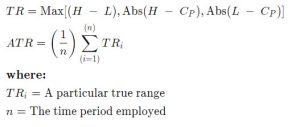
The first step involved in the calculation of ATR is to find the series of true range values for that particular stock.
The true range for a stock is calculated as follows-
The formula can be simplified to:
We can change the ATR settings according to our trading styles. For example, if we want to do Intraday Trading, we can use shorter periods than the default 14-days period. Using shorter periods for Intraday Trading creates more signals with low probability, whereas longer periods have a higher probability of winning but minor occurrence.
For example, let’s say that a swing-trader wants to calculate the ATR for the last 7 days. Therefore, the trader can calculate 7 days ATR by considering various factors of the previous 7 days.
For finding the ATR of the last 7 days, the trader has to find the maximum of the absolute value of the current high minus the current low, the absolute value of the current high minus the previous close, and the absolute value of the current low minus the previous close. These calculations are done for the last 7 days and then averaged down to calculate the value of 7-day ATR.
As every indicator in the Technical Analysis has some limitations
Here are some limitations of ATR.
ATR does not tell us precisely in which direction the breakout will happen, and it tells you the possibility of breakout on either side when the stock is consolidating. Trading Signals generated by the ATR are relatively less occurring but usually identify significant breakout points, enabling traders to capture big moves in the market.
The second limitation is there is no specific rule that the particular value of ATR will tell you whether the trend is going to continue or it’s going to reverse. Every trader may have a different perspective on the same value of ATR. So, by just looking at the ATR, no one can decide whether the particular trend will sustain or reverse.
The third limitation of ATR is it is a volatility index, not a directional index. Generally, ATR indicates the volatility in the market, and there is no relation of ATR with the direction of the stock.
These are some of the limitations of the ATR index. ATR can be very useful for swing trading as it generates fewer signals but has a high probability of success.
I hope that through this article, you were able to understand how ATR works and how traders use ATR to get an idea of the current volatility in the market. If you are interested in learning more about different indicators used in the technical analysis, you can definitely check out my blog on ‘What are Indicators and Oscillators | Beginner’s Guide to The Stock Market | Module 15’.
If you have any queries regarding this topic, please post them in the comment section. Happy Learning!
If you want to know more about Risk Management & Intraday Trading Strategies you can refer to our previous blog on
Importance Of Risk Management In Trading and 10 Best Intraday Trading Strategies.
Open a Demat Account using our link to get support from us – https://bit.ly/3gyhIWN and send your ID to [email protected]