

Chart patterns are an important aspect of technical analysis, and even if you master one chart pattern and trade with risk management rules for a longer time, you can become a successful trader. So, here are the Top 8 Important Chart Patterns In Technical Analysis That Every Trader Needs To Know-
This is the most important chart pattern in technical analysis. Head and shoulder patterns are reversal patterns, and they are generally formed at the market tops. In this pattern, the first left peak is formed which is called the left shoulder, and after that, price breaks the level of the left shoulder and immediately takes resistance from there forming the head of the pattern. After taking support from the neckline, the price again tries to go up further, but it takes resistance from above levels forming the right shoulder, and then it breaks the neckline which indicates the short entry.
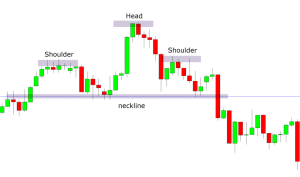
As we can see in the above figure, after taking rejection from the right shoulder, the stock has made a heavy red candle that confirms the breakdown from the neckline. When the price closes below the neckline, a potential short trade is signalled. Generally, the target is equal to the vertical distance between the ‘apex’ of the head and shoulder and the distance from the neckline. After a trade entry, if the price closes above the neckline, a potential failure of the pattern is indicated so stop-loss can be set above the neckline.
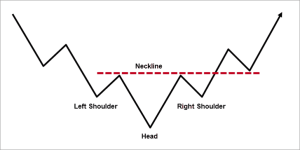
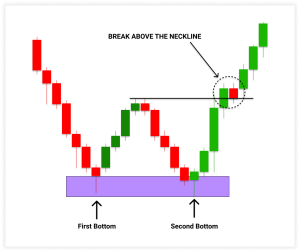
Inverse head and shoulder pattern is exactly opposite as that of normal head and shoulder pattern. Inverse Head and shoulder pattern is formed at the bottom of the downtrend and indicates the potential uptrend after the potential breakout from the trendline.
The Double Top Pattern is a trend reversal pattern that is generally formed at the top of the uptrend indicating the potential reversal. In this pattern, price first makes the up move and takes resistance from a certain level, and after taking the support from the neckline, price again tries to go up but takes the resistance from the same level indicating the formation of a double top pattern.
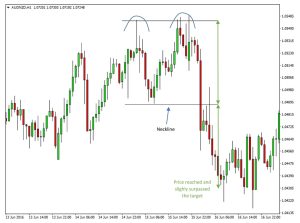
As we see in the above example, after taking the resistance from the same level twice, the stock broke the trendline and dips below. A double top confirmation has occurred at the breakdown from the neckline and short trade can be initiated after this. Double top patterns provide a good risk to reward ratio. The target for this trade is equal to the distance between the top of the pattern to the neckline. Sometimes, the double top pattern also fails and tries to form triple or multiple top patterns which are stronger than the double top pattern.
The Double Bottom Pattern is exactly the opposite of the double top pattern. This pattern is generally formed at the end of the downtrend indicating a new uptrend after the breakout from the neckline.
An ascending triangle is a bullish trend continuation pattern that confirms the continuation of an uptrend. The ascending triangle pattern is bound by two trendlines: a horizontal line at the top and an upward slope trend line connecting the lower lows. This pattern is quite reliable compared to other patterns.
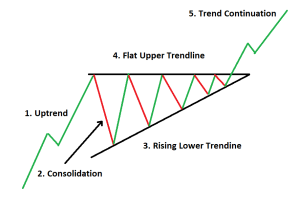
After the confirmation of the breakout from the upper trendline, long trade can be initiated. Ascending triangles can give excellent targets. The first target would be equal to the depth of the triangle. In short, calculate the distance between the top trendline and lowest of the down trendline and add this depth to the breakout point, and this would be your target. Also, targets can be set at 50% of depth for partial exits. Place the stop loss order below the slope trendline.
A Descending Triangle Pattern is a bearish trend continuation pattern that confirms the continuation of the downtrend. The descending triangle pattern is bound by two trendlines; one is a downtrend slope trendline, and the other is a flat trendline that connects the lows of the pattern.
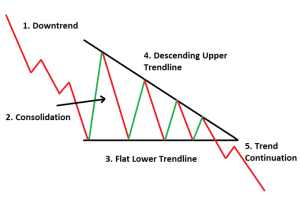
After the confirmation of the breakdown from the lower trendline, a short trade can be initiated. The descending triangle can give excellent targets. The first target would be equal to the depth of the triangle. Also, partial profits can be booked after the price reaches 50% of the triangle depth.
This pattern forms when there is indecision in the market. The symmetrical triangle pattern can be easily spotted when prices make lower highs and higher lows. These kinds of patterns are formed when there is equal supply and demand in the market.
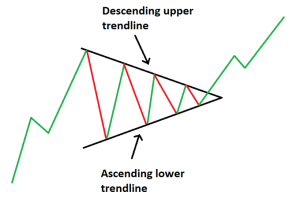
Trades can only be initiated at breakouts or breakdowns. Enter a long trade when price breaks the descending upper trendline and sustains above it. Sell trade can be initiated if the price breaks the lower trendline and sustains below it. Most symmetric triangles give 100% of the depth rise/fall of the entire triangle as a target. Symmetrical triangles failure occurs when price results in false breakouts.
Flag and pole are the continuation patterns representing a small break in market trend. They can be easily spotted on the charts as they appear right after a quick breakout or breakdown from a trading range. In strong trending markets, flags are formed as prices consolidate for some time, and again start to move in the same direction. These are very reliable patterns.
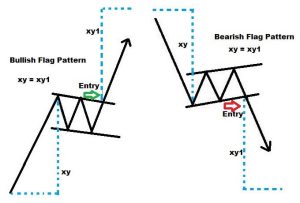
After the breakout from the prior range, the price shoots up and makes lower highs and lower lows in case of bullish flag and pole, and in case of bearish flag and pole, the price makes higher highs and higher lows after breaking down from the previous level. Trade can be initiated once the price breaks the above trendline, and the target can be set equal to the distance from the previous breakout to the first high of the flag (denoted by ‘xy’).
In the case of a bearish flag and pole pattern, trade can be initiated when the price breaks down from a lower trendline, and the target can be equal to the distance from the previous breakdown to the first support of the flag. (Denoted by ‘xy’). Place a stop-loss order below the ‘low’ of the ‘flag’.
I hope through this article, I was able to explain to you the most useful and frequently occurring chart patterns in technical analysis. If you want to know more about technical analysis, then you can definitely refer to my previous blog on Importance of Multiple Time Frame | Beginner’s Guide to The Stock Market | Module 10. Also, if you have any queries regarding this topic, please post them in the comment section.
If you want to know more about Risk Management & Intraday Trading Strategies you can refer to our previous blog on
Importance Of Risk Management In Trading and 10 Best Intraday Trading Strategies.
Open a Demat Account using our link to get support from us – https://bit.ly/3gyhIWN and send your ID to [email protected]
Happy Learning!

Best Academy!!!
Best ever institution for stock Marketing
??❤️
Thank you, Soham, glad that you find the blog helpful.
Thanks you for all your guides. From zero to something
Thank you, Pratik, glad that you find the blog helpful. We constantly try to bring helpful blogs for our traders and will continue doing so.
Trading ke liye kya ye 8 pattern bahut hai .
Hello I want to take class offline
If you have any schedule plz tell me
Give us a call on this number for details +91-8130245100
9AM to 9PM : Working Hours
Excellent. Keep posting such informative & educational technical patterns
Thank you, Mayur, glad that you find the blog helpful. We constantly try to bring helpful blogs for our traders and will continue doing so.
Good analysis. Really liked it. Would love to have more of this to learn more !
Thank you, Sushil, glad that you find the blog helpful. We constantly try to bring helpful blogs for our traders and will continue doing so.
It is true good thank you
Very well explained. Really beneficial to the beginners. Thank you very much.
Thank you, Shreekanth, glad that you find the blog helpful. We constantly try to bring helpful blogs for our traders and will continue doing so.
Excellent
Thank you for such informative article. We always see these patterns but miss entry. Now we can try to get it at right time ?
Thank you, Sujit, glad that you find the blog helpful. We constantly try to bring helpful blogs for our traders and will continue doing so.
thank you sir
Very Nice article, Thanks for posting
Thank You Vipin, glad that you find the blog helpful. We constantly try to bring helpful blogs for our traders and will continue doing so.